Data Center
Questions about any of the following data? Please email Senior Education Developer, Bernie DeGraw or Steven Netsch, Director of Research and Strategic Insights
Marine Market Navigator Dashboard
The Marine Market Navigator Dashboard helps you track the economic and marine industry metrics that shape consumer behavior, financing and inventory demand. By monitoring these indicators, you gain clearer insight into market shifts and can make confident, informed choices that support your dealership’s long-term health.
Pulse Reports
In partnership with Soundings Trade Only and Baird Research, MRAA produces a monthly “Pulse Report,” which helps to identify today’s trends and dealer sentiment to help you make more informed decisions for your business.
MEMBERS ONLY:
MRAA Industry Insights
Gain a better understanding of the Pulse Reports. These short videos provide a brief overview of the Pulse Reports.
Marine Industry Compensation Study
The 2025 Marine Retail Compensation Study is built from dealer‑reported data across North America and offers the industry’s most detailed look at compensation, benefits, and workforce structure. Developed in partnership with Readex Research, this in‑depth report provides marine retailers with actionable benchmarks to support hiring, compensation planning, retention efforts, and organizational strategy.
Note: MRAA Members: Gain Exclusive Access to the Executive Summary here
IDS Marine Dealership Industry Insights
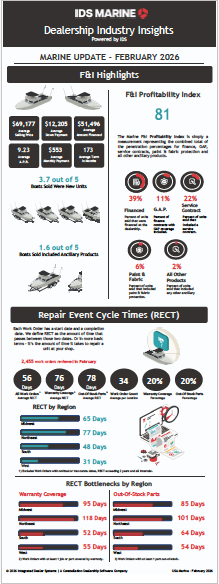
Dealership Industry Insights is published monthly by IDS Marine, an MRAA Education Champion. This visual report shares unit sales, F&I insights and repair event cycle time (RECT) benchmarks based on aggregated data from marine dealerships across the nation.
February 2026 Marine RECT Recap
- Repair event cycle times at U.S. marine dealerships remained elevated in February 2026.
- The average RECT across all work orders was 56 days. The average RECT in February 2026 was two days longer than February 2025.
- IDS Marine reviewed 2,455 work orders for the February report.
- The primary bottlenecks impacting RECT continued to be warranty coverage and out-of-stock parts.
- Work orders with warranty coverage averaged 10 days (76) faster in February 2026 compared with February 2025
- Work orders impacted by out-of-stock parts averaged 78 days.
January 2026 Marine RECT Recap
- Repair event cycle times at U.S. marine dealerships increased in January 2026.
- The average RECT rose to 63 days, up from 45 days the month prior.
- January had the slowest average of the previous 8 years going from 2018-2025, and was 11 days longer than January 2025.
- The main bottlenecks — warranty coverage and out of stock parts — RECT increases in January.
- Work orders with warranty coverage averaged 78 days, a 10-day increase from December’s average.
- Work orders with out-of-stock parts averaged 71 days. That was up 10 days from December 2025.
2025 Marine RECT Recap
- Repair event cycle time (RECT) at U.S. marine dealerships increased in December 2025.
- The average RECT rose to 45 days, up from 32 days in November.
- The average RECT in December 2025 (45 days) is similar to the previous four years (2021–2024), and slightly higher than most pre-pandemic years.
- Both main bottlenecks — warranty coverage and out-of-stock parts — saw cycle times increase in December.
- Work orders with warranty coverage averaged 68 days, a slight increase from November’s 64 days.
- Out-of-stock part work orders averaged 61 days, up from November’s 51 days.
2024 Marine RECT Recap
Have questions about the infographic or RECT information? Please contact Don Miller, IDS Marine Senior Data Innovation Manager.
Service Management Special Report
The Service Management Special Report takes a deep dive into all things service. Access data, insights and a robust portal of resources on dealer demographics, workforce, pain points, and key service department metrics that can drive performance improvements.
Use this report to determine where you stack up against others in the marine retail industry and then take action to improve.
- “Does my average proficiency fall above the average of the survey participants?”
- “How does having a process map influence various service pain points?”
Answers to these questions and more can be found within!
Not ready to purchase?
MRAA Members Only: Download the Executive Summary!

2025 Marine Market Insights
To navigate the uneven-but-evolving market, your dealership needs data that help you make better decisions. J.D. Power and the MRAA have collaborated to share the 2025 Marine Market Insights report, offering a clear snapshot of how the marine marketplace performed over the past year. This report includes a high-level market overview, year-over-year retail value trends by boat category, values versus shopper traffic and brand-level research activity. Use this data to better understand market signals and plan with greater confidence.
2024 Data
Boats Group 2024 Mid-Year Market Index
• Boating Market Report: New Boat Sales Increase as Prices Drop
The boating market’s current landscape is one of contrasts and adjustments. While new boat sales are climbing, used boat sales are falling sharply. Inventory levels, pricing trends and economic pressures continue to shape buyer behavior and market dynamics.
Download the 2024 Mid-Year Market Index from Boats Group, an MRAA Strategic Partner, includes a market analysis of boats sold by length group, location, power versus sail and more.
ff
Marine Industry Compensation Study
With the 2022 Compensation Study, more than 980 position-level responses were collected from a total of 103 retail locations for this in-depth report, which was created in response to an industry-driven desire to identify staffing and compensation trends for dealership employees across North America. The results of the study are being shared with the industry through an executive summary and a full report.


Data Infographics
Calling all visual learners! Marine Industry Data can be a lot sometimes. MRAA develops easy to follow infographics to help sort that data. Each month, MRAA develops an infographic with timely data and information for your dealership to use to better understand what’s going on in the industry.